
Google Ads
Google Ads Budget Waste: How to Find and Fix Avoidable Spend
Most wasted spend in Google Ads comes from settings, search terms and tracking rather than fraud. Here is how to find it, check it and decide what to fix first.
When results change suddenly, the order of your checks matters. This diagnostic sequence rules out tracking, account changes and market shifts before blaming fraud.
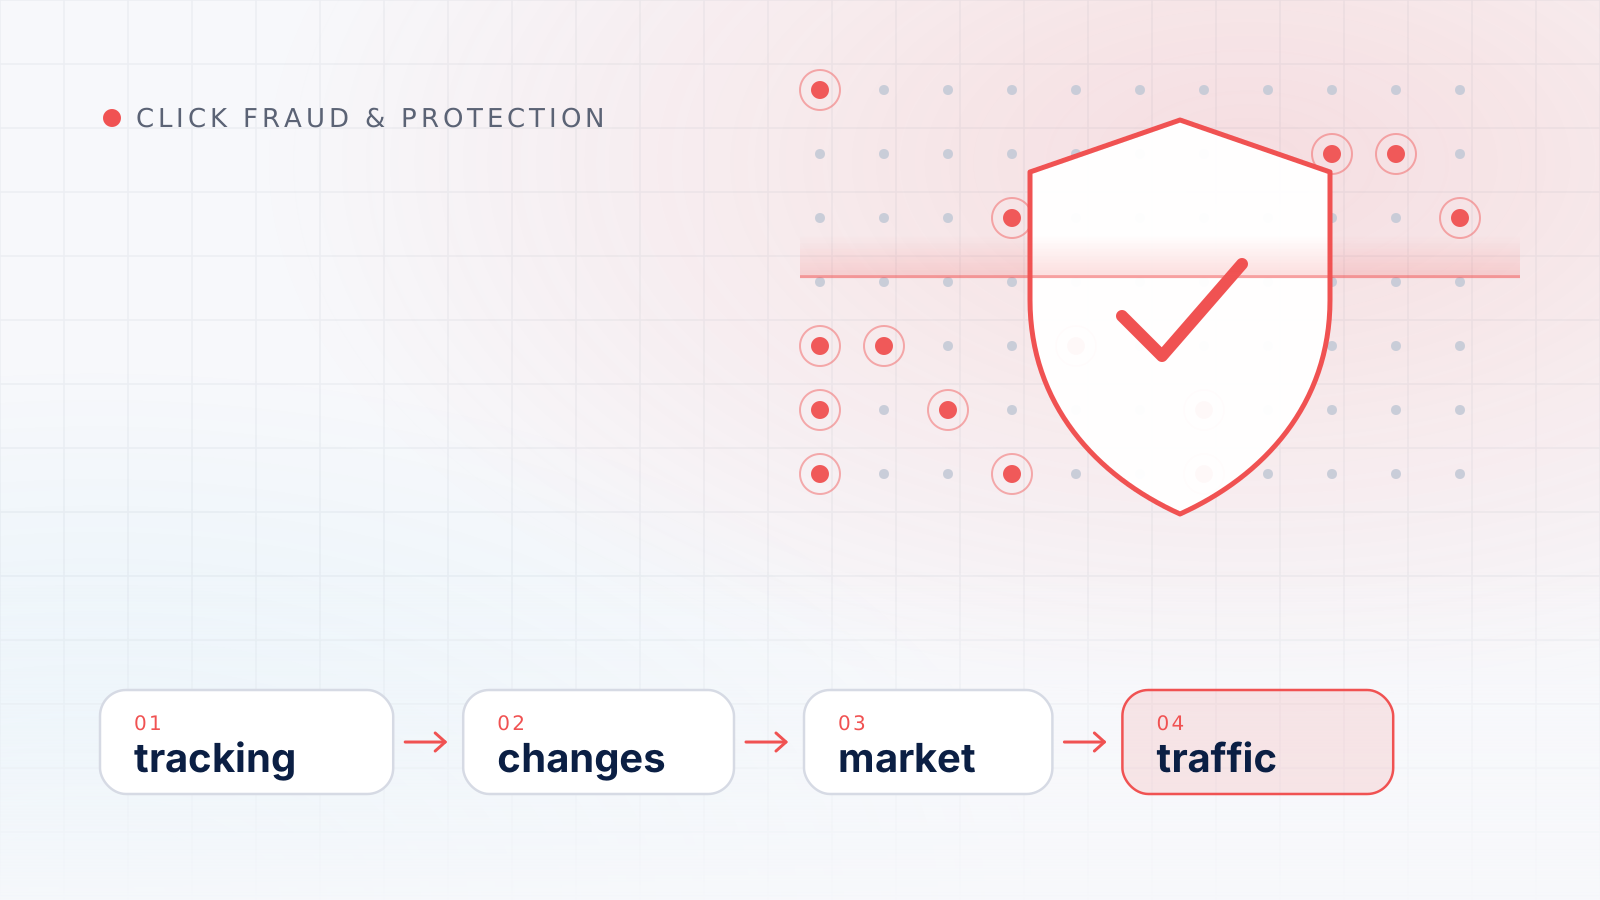
A Google Ads performance investigation is a structured check of the likely causes of a sudden change, done in an order that rules out the common, easy-to-verify explanations first. If you are asking why your Google Ads performance dropped, confirm the measurement first, then look at what changed in the account, then at the market, the website and ad eligibility, and only then at traffic quality.
This guide sets out that order, names the Google Ads tools that help at each step, walks through an illustrative investigation and explains what evidence actually points to invalid traffic. The aim is a diagnosis you can defend, not a guess.
When results fall, the most dramatic explanation tends to get attention first: a competitor clicking ads, a bot, an algorithm change. In practice, sudden changes often trace back to something ordinary, such as a broken tag, a budget edit, a new competitor or a seasonal dip. Those causes are also the quickest to confirm or rule out.
A fixed order has two benefits. It saves time, because each step is cheap and can end the investigation early. And it protects you from false conclusions: if you start by hunting for fraud, almost any anomaly can look like evidence. Slow, structural problems such as loose keyword matching belong in a routine review of avoidable budget waste; this guide is for changes that appear suddenly.
Before step one, define the change precisely:
If conversions fell while clicks and cost held steady, suspect the measurement before the marketing.
If tracking did break, fix it, then consider a data exclusion for the affected dates. Google recommends data exclusions for a conversion data outage, such as broken conversion tracking for a period, to reduce the impact on Smart Bidding, and says they aren’t intended to be used frequently or for long periods. How the platform credits conversions also matters when numbers look odd; our guide to ad attribution and its limits covers that side.
Most sudden shifts follow a change, and Google Ads records many of them.
Change history. Google’s change history lists changes to your account, campaigns and ad groups over the past two years. You can filter by date range, type of change and campaign, and the User column shows who made each change, including automated and API changes. Google says it maps each change onto a timeline of account data such as impressions, clicks, conversions and cost, which makes it easier to line up a change with the start of a decline. Google also notes that some account-level setting changes may not be listed.
Look in particular for:
Explanations. Google’s explanations feature gives insights into large changes in account performance for Search, App, Performance Max, Demand Gen, Display and Video campaigns. Its categories include bidding, budget, conversion settings, targeting changes, auction competition and search interest, and change history. Explanations aren’t available when the date range includes today or goes further back than the last 90 days, and they may not appear if a change isn’t significant enough.
Treat explanations as leads to verify rather than verdicts.
If nothing changed inside the account, something may have changed outside it.
Competition. Auction insights lets you compare your performance with other advertisers in the same auctions. It is available for Search, Shopping and Performance Max campaigns. For Search it shows impression share, overlap rate, outranking share, position above rate, top of page rate and absolute top of page rate. Google notes that the report doesn’t show insights when impression share is below 10%, and that a competitor’s impression share in your report may differ from what they see in theirs. A new advertiser with a rising overlap rate, or a familiar one suddenly ranking above you far more often, is a plausible cause of higher costs or fewer clicks.
Demand and seasonality. Compare the same period last year, and check external events: holidays, weather, news, school calendars, a competitor’s sale. A decline in impressions across every campaign at once usually reflects demand, not a problem in the account.
This is the core of campaign diagnostics. A decline spread evenly across everything suggests a broad cause such as tracking, demand or budget, while a decline concentrated in one segment narrows the search. Break the affected period down by:
| Dimension | What a concentrated change might mean |
|---|---|
| Search terms | New or broader queries diluting intent |
| Device | A mobile-only page or form problem |
| Location | A settings change, or demand moving between areas |
| Network | Shift in partner or Display traffic |
| Hour and day | A schedule change, or a narrow window of unusual activity |
| Campaign or ad group | A local edit, disapproval or budget limit |
If location is the outlier, review the settings first; our guide to location targeting options and reports explains why out-of-area clicks are often legitimate.
The site. A release that changed a form, checkout, page speed or URL structure can cut conversions without any change in Google Ads. Test the main path yourself on mobile and desktop, ask whoever manages the site what shipped and when, and check server or uptime logs for outages.
Ad and asset status. Google says a disapproved ad can’t run because its content or its destination violates Google Ads policy and won’t receive impressions, while statuses such as “Eligible (limited)” mean an ad can run with restrictions. Review the Status column for ads and assets, and add the Policy details column to see why an ad isn’t eligible. A disapproval on a high-volume ad, or on the landing page it shares with other ads, can explain a sudden drop in impressions.
With measurement, changes, market, site and eligibility ruled out, traffic quality is a reasonable next question. Start with what Google reports: the Invalid clicks column shows traffic that Google’s systems already filtered, and Google says it catches most invalid traffic shortly after the ad interaction, with later detections credited on invoices and in account transactions.
Then compare ad data with site behavior for the affected segment: engagement, form quality and the click-to-session relationship. Reading individual visits carefully, without jumping to conclusions, is covered in our guide to investigating suspicious ad sessions.
The following scenario is hypothetical, with round numbers chosen for clarity.
Imagine a lead-generation account that normally records about 50 conversions a week from roughly 1,000 clicks and $2,000 of spend: a 5% conversion rate and $40 per conversion. One week it records 30 conversions from the same clicks and spend. The conversion rate falls to 3% and the cost per conversion rises to about $67.
Had the investigation started with traffic quality, the stable click volume and normal-looking sessions would have offered nothing to find, and days could have gone into IP lists and blocking. Had the CRM also shown a drop, the next stops would have been change history and auction insights. If your numbers disagree in ways that this order doesn’t explain, check them against our list of common advertising reporting mistakes.
Invalid traffic becomes a reasonable explanation when several of these appear together, and the earlier steps found nothing:
Even then, keep the conclusion proportional to the evidence. Shared and carrier networks, privacy tools and prefetching can all produce odd-looking data. Document what you found, with dates, segments and screenshots, and compare it with the invalid click data Google reports. Google’s invalid traffic page, linked in step 6, also says advertisers can submit an invalid traffic investigation request for activity within the last 60 days. Our method for detecting click fraud with evidence shows how to build that case, and our explainer on how Google Ads counts clicks helps when you need to reconcile click numbers along the way.
Keep reading
Google Ads
Most wasted spend in Google Ads comes from settings, search terms and tracking rather than fraud. Here is how to find it, check it and decide what to fix first.
Measurement
Most misleading ad reports come from a handful of predictable errors. Learn why clicks and sessions differ, how Google Ads dates conversions and how to stop double counting.
Click fraud
A single odd visit proves very little. Learn to examine individual paid sessions, separate real warning signs from harmless quirks and decide when to escalate.